
In April 2022, business intelligence dashboard provider, Intuitive, announced the release of its latest version of Intuitive for PaperCut.
Intuitive for PaperCut V3, has had a complete visual refresh, and incorporates many powerful new features. The dashboards incorporate filters, which provide more granular scope of your data, and grid row totals, which allow you to calculate sums, averages and high/low values in your components.
The new dashboards include a built-in menu system allowing you to seamlessly navigate around. We’ve also added a handy QR code on each dashboard which opens an Intuitive “How to” video guide relevant to that dashboard.
SOS are currently offering a free no obligation 40 day trial of Intuitive for PaperCut V3. Click here to find out more.
The new version includes 8 pre-configured dashboards as standard including:
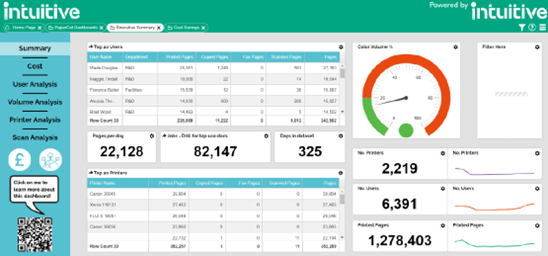
- Executive Summary – see your top 20 users & printers, analyse the number of users, see total pages printed.
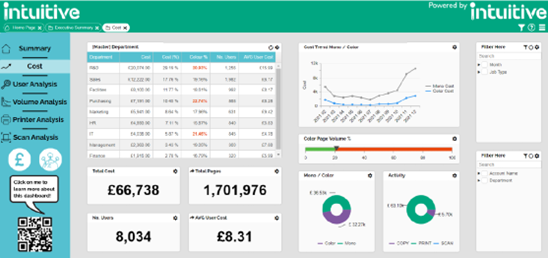
- Cost – analyse costs over time, by department and user, compare mono vs colour and print vs. copy costs.
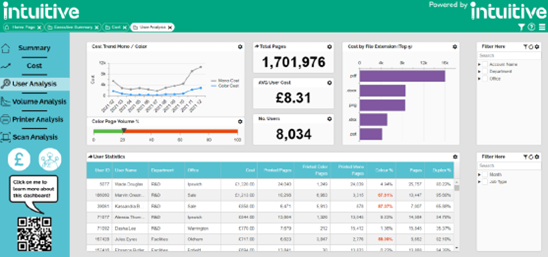
- User Analysis – see a breakdown of print usage by user and analyse by individual user.
- Volume Analysis – see the print / scan / copy volume change (this year vs last year), printed pages and volume trends.
- Printer Analysis – analyse printer variance, activity and utilisation
- Scan Analysis – Summary of scan activity, further analyse by individual user.
- Cost and Volume Summary – see the impact of printing volumes and costs over a two-year rolling period, see the split of colour pages, total pages and cost
- Environmental Impact – see the environmental impact of your printing (CO2, energy, trees consumed) by department over a two-year rolling period
We’ve also added dashboards to help our resellers with their customer reviews, and also to support them in identifying opportunities for digital transformation in their customer accounts.
About Intuitive
Intuitive is a global provider of Data Visualisation Tools for Application Developers and Software Resellers. Formed by a team of highly experienced entrepreneurs and software developers the aim of Intuitive BI from the outset was to create a different type of BI solution. The team recognised that for Business Intelligence to deliver, companies needed easy to use tools that could be deployed to all employees and beyond organisational boundaries to customers and suppliers.
Intuitive BI sells exclusively through its network of value-added partners. We work closely with our partners in specific application areas such as Print and Process Management so that data held within their applications can be made more valuable to customers.

